
Bull flag vs bear flag is one of the first comparisons traders learn—and one of the easiest to get wrong.
At first glance, the two patterns look almost identical. Both begin with a strong price move, followed by a brief period of consolidation before the trend continues. It’s easy to see why many beginners confuse them.
The difference, however, isn’t the flag itself. It’s the trend that comes before it.
Once you learn to identify that context, telling a bull flag from a bear flag becomes much more straightforward. Instead of memorizing chart shapes, you’ll start to understand what the market is actually communicating.
In this guide, you’ll learn how each pattern forms, what it reveals about market sentiment, and how traders use bull and bear flags alongside volume and price action to identify potential continuation opportunities.
What Is Bull Flag vs Bear Flag?
Before diving into each pattern individually, it’s worth understanding why traders often compare them.
A bull flag and a bear flag are both known as continuation patterns. In other words, they suggest that the market is likely to continue moving in the same direction after a brief pause. That’s why you’ll often hear experienced traders say that a flag isn’t a reversal signal—it’s a sign that the existing trend may still have room to run.
These patterns regularly appear across major cryptocurrencies, including Bitcoin and Ethereum, especially during periods of strong market momentum.
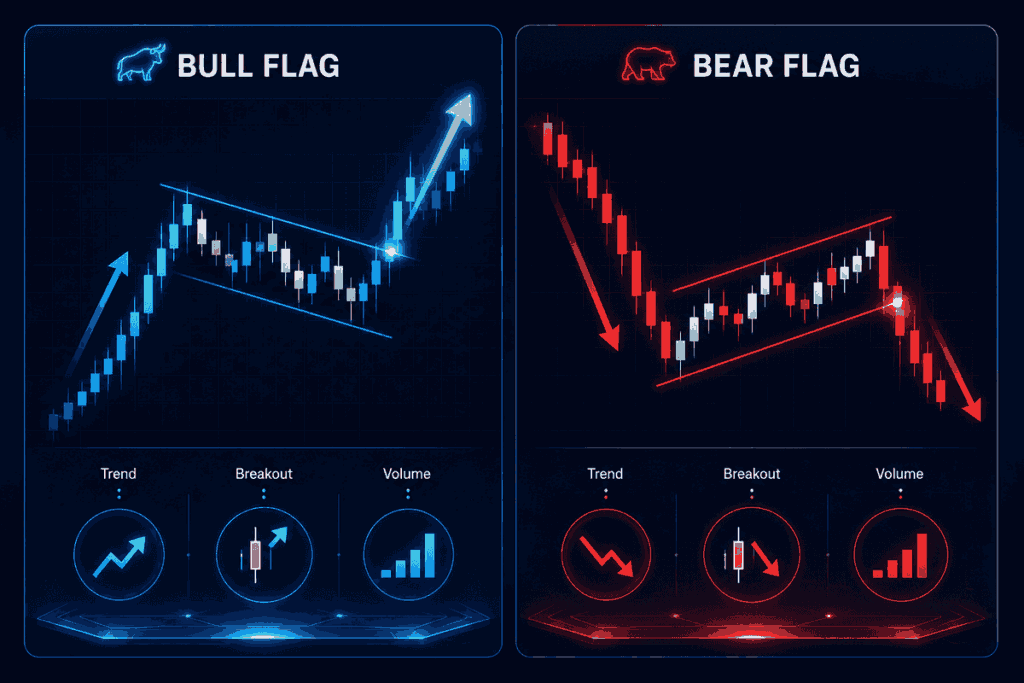
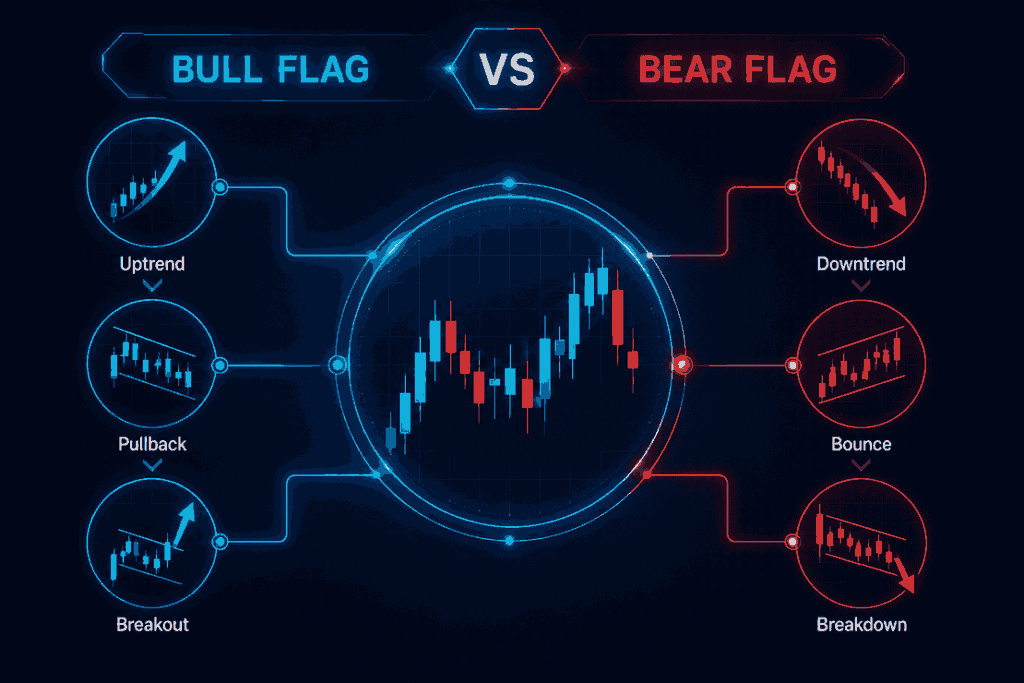
Although the two formations share a nearly identical structure, they’re built on opposite market conditions.
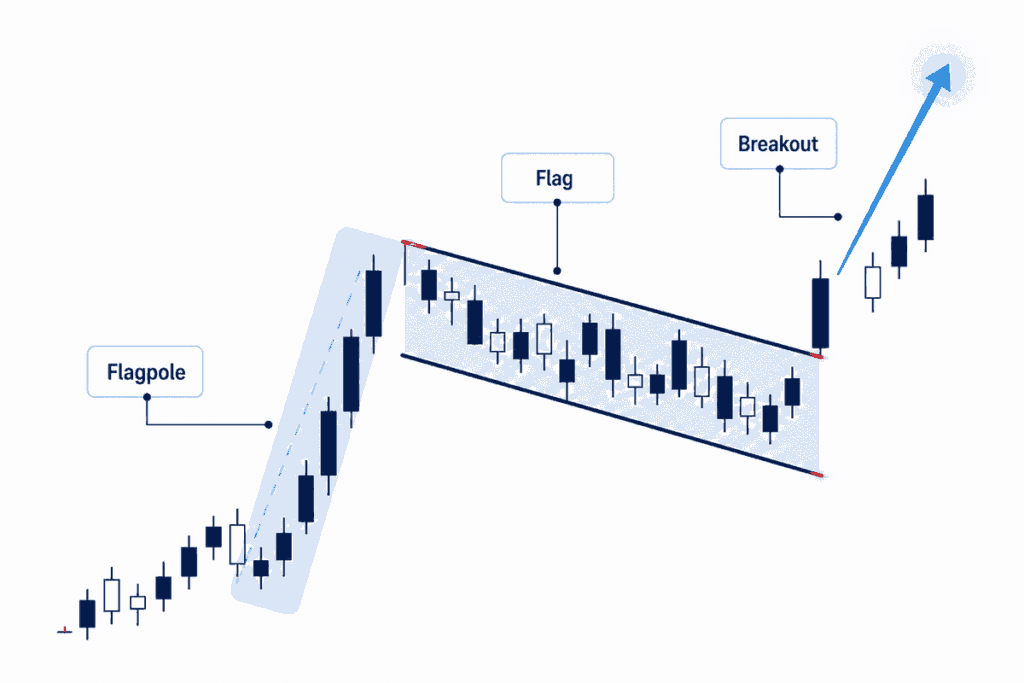
A bull flag develops after a strong upward move. Buyers pause to take profits, price drifts sideways or slightly lower, and if demand remains strong, the market eventually breaks higher.
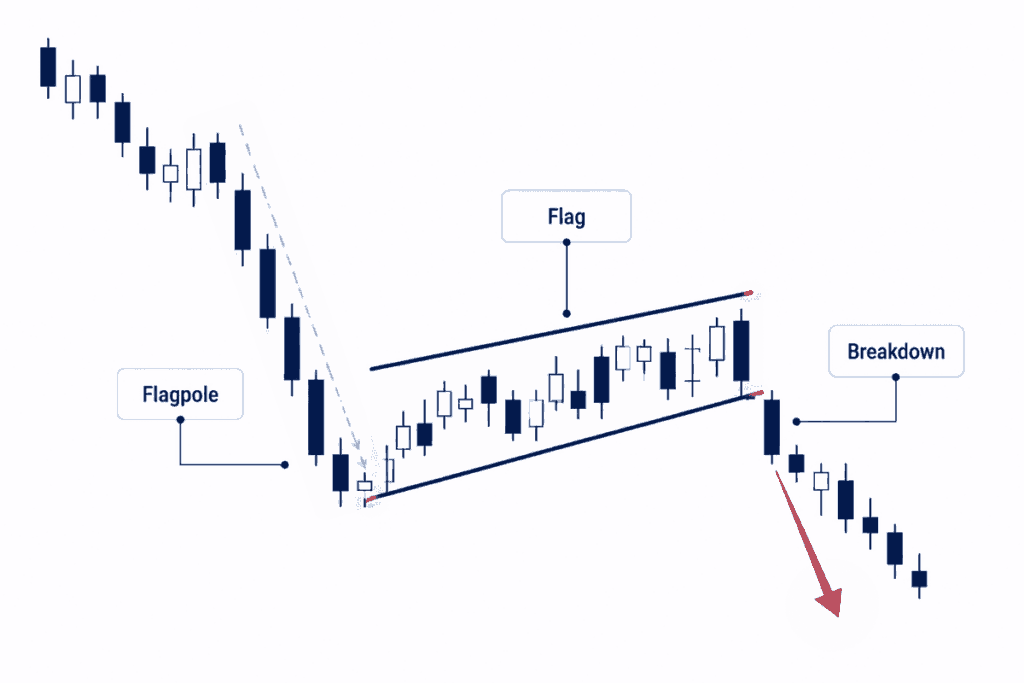
A bear flag, on the other hand, appears after a sharp decline. Sellers temporarily lose momentum, allowing prices to recover slightly. If bearish sentiment remains dominant, that recovery fades and the market continues moving lower.
Think of them like runners in a race.
A runner doesn’t sprint at full speed from start to finish. Instead, they briefly slow down, catch their breath, and then accelerate again. Flag patterns represent that pause in the market. The trend takes a short break before attempting its next move.
This is also why the trend leading into the pattern matters far more than the flag itself. Two charts may look almost identical, but if one follows a strong Bitcoin rally while the other appears after a steep Ethereum sell-off, they tell completely different stories.
Bull Flag vs Bear Flag at a Glance
Feature
Bull Flag
Bear Flag
Overall Trend
Uptrend
Downtrend
Flagpole
Strong rally
Sharp decline
Consolidation
Slight pullback or sideways movement
Small rebound or sideways movement
Expected Breakout
Upward
Downward
Typical Trade Direction
Long
Short
Market Psychology
Buyers pause before continuing higher
Sellers pause before continuing lower
The table above provides a quick overview, but don’t worry if everything isn’t clear yet. In the following sections, we’ll break down each pattern in detail so you can recognize them confidently on real price charts.
What Is a Bull Flag Pattern?
Once you understand the idea behind continuation patterns, the bull flag pattern becomes much easier to spot.
At its core, a bull flag represents a market taking a short breather.
After a strong rally, buyers naturally become less aggressive for a while. Some traders secure profits, while others wait for a better entry.
If demand remains strong, that pause often ends with another move higher.
One important thing to remember is that a bull flag doesn’t appear randomly. It forms because buyers are still in control. The temporary pullback reflects hesitation, not a complete shift in market sentiment.
This distinction is what separates a healthy bull flag from the early stages of a reversal.
How Does a Bull Flag Pattern Form?
Although every chart looks slightly different, most bull flag patterns follow the same sequence.
1. A Strong Uptrend Creates the Flagpole
A bull flag doesn’t appear out of nowhere. Before the pattern can form, the market usually needs a strong burst of buying momentum that catches traders’ attention.
This initial rally—known as the flagpole—usually happens because buying pressure suddenly overwhelms selling pressure. The move is often supported by higher trading volume, positive market sentiment, or a catalyst such as strong earnings, favorable economic news, or a bullish crypto event.
Without a clear and decisive rally, there’s no flagpole, which means there’s no true bull flag.
2. The Market Takes a Breather
After such a sharp advance, it’s perfectly normal for price to slow down.
Some traders begin taking profits, while others hesitate to buy after a rapid rally. As a result, price starts moving sideways or drifts slightly lower inside a narrow channel.
This consolidation creates the flag.
The key point here is that sellers never take complete control. Instead, the pullback remains relatively shallow, showing that buying interest is still present.
Healthy bull flags often share these characteristics:
- A short consolidation period
- Small, controlled pullbacks
- Parallel trendlines forming the flag
- Lower trading volume than during the initial rally
- No major breakdown below key support
If price falls too deeply, the setup may no longer qualify as a bull flag.
3. Buyers Return
Eventually, buyers regain confidence.
Fresh demand enters the market, trading volume increases, and price breaks above the upper boundary of the flag.
This breakout is what many traders wait for before entering a position or deciding to buy crypto.
Rather than trying to predict the breakout, experienced traders often prefer to wait for confirmation. A decisive move above resistance, supported by strong volume, generally provides more confidence than entering while the market is still consolidating.
Why Does a Bull Flag Work?
Understanding why the pattern forms is just as important as recognizing its shape.
Every candlestick represents a decision made by buyers and sellers. A bull flag reflects a market where buyers remain confident, even after a significant rally.
Imagine that a stock jumps 15% in just a few days.
Some investors decide to secure their profits, creating mild selling pressure. At the same time, other traders who missed the rally hesitate to buy at higher prices. Instead of continuing straight upward, the market pauses while supply and demand briefly come back into balance.
As long as sellers fail to push price significantly lower, buyers gradually regain confidence. New demand enters the market, resistance breaks, and the uptrend resumes.
That’s why many traders view a bull flag as a sign of strength rather than weakness.
The market isn’t reversing—it simply needed time to digest its previous gains.
Market Psychology Behind a Bull Flag
Looking beyond the chart itself can make a bull flag much easier to understand.
A bull flag doesn’t suggest that buyers have lost control. Instead, it reflects a brief pause in momentum while the market digests its recent gains. Although buying slows during the consolidation, sellers never generate enough pressure to reverse the trend.
Once demand starts to build again, buyers regain control and price breaks above resistance. That’s why many traders view a bull flag as a sign of underlying strength rather than weakness.
Stage What Buyers Think What Sellers Think
Strong Rally
“Momentum is building.”
“I’ll wait for a better price.”
Consolidation
“I’m holding my position.”
“Maybe this rally is over.”
Breakout
“Time to buy.”
“I need to cover my short position.”
Continuation
Buying momentum accelerates.
Selling pressure fades.
How Traders Confirm a Bull Flag
One of the biggest mistakes beginners make is assuming every downward-sloping channel is automatically a bull flag.
In reality, experienced traders usually look for additional confirmation before entering a trade.
Some of the most common confirmation signals include:
- A strong breakout candle closing above resistance
- Increasing trading volume during the breakout
- The overall market trend remaining bullish
- Price holding above the breakout level
- Momentum indicators supporting the move
No single confirmation guarantees success, but combining several factors can improve the probability of a successful trade.
Common Mistakes When Trading a Bull Flag
Even well-formed patterns can fail, especially if traders rush into positions too early.
Some of the most common mistakes include:
Entering Before the Breakout
Buying while price is still moving inside the flag increases the risk of getting caught in a deeper pullback.
Waiting for confirmation requires more patience, but it often reduces unnecessary risk.
Ignoring Trading Volume
Volume tells an important part of the story.
If price breaks above resistance without a noticeable increase in trading activity, the breakout may lack conviction and become more vulnerable to failure.
Mistaking a Reversal for a Bull Flag
Not every pullback during an uptrend forms a continuation pattern.
If the decline becomes too steep or breaks important support levels, the market may be transitioning into a genuine trend reversal rather than preparing for another rally.
Forgetting the Bigger Picture
A bull flag that appears during a broader downtrend deserves extra caution.
Many experienced traders check higher timeframes before entering a trade to make sure the overall market structure still supports a bullish continuation.
What Is a Bear Flag Pattern?
If a bull flag represents a temporary pause in an uptrend, a bear flag pattern tells the opposite story.
It develops after a strong decline, followed by a short-lived recovery or a period of sideways movement. Although the bounce may look like the beginning of a reversal, it often reflects nothing more than a brief pause before sellers regain control.
This is why bear flags can be deceptive. To inexperienced traders, the recovery may appear bullish. However, experienced traders pay closer attention to the broader trend. If the market was already falling sharply before the consolidation, there’s a good chance the bounce is simply a pause—not the start of a new uptrend.
Like its bullish counterpart, a bear flag is a continuation pattern. The expectation is that the existing downtrend will continue once the consolidation ends.
How Does a Bear Flag Pattern Form?
While no two charts are exactly alike, most bear flag patterns follow a similar sequence.
1. A Sharp Sell-Off Creates the Flagpole
Every bear flag starts with a decisive move lower.
This initial decline forms the flagpole and usually reflects strong bearish sentiment. The sell-off may be triggered by disappointing earnings, negative economic data, regulatory news, or a broader market correction. In cryptocurrency markets, sudden liquidations or shifts in investor sentiment can also create the rapid downward momentum needed to form a bear flag.
The steeper and more impulsive this move is, the more meaningful the flagpole tends to be.
2. Price Begins to Recover
Markets rarely move in a straight line for long.
After a sharp drop, some short sellers lock in profits while bargain hunters attempt to buy what they believe is a discounted asset. As buying pressure temporarily increases, price begins to recover.
This recovery forms the flag.
Unlike a genuine trend reversal, however, the rebound remains relatively modest. Instead of making new highs, price usually trades within a narrow upward-sloping or sideways channel.
That limited recovery is an important clue. It suggests buyers are active, but not strong enough to fully reverse the existing downtrend.
Healthy bear flags often display:
- A brief upward correction
- Parallel trendlines
- Lower trading volume during consolidation
- Weak bullish momentum
- Lower highs forming inside the flag
3. Sellers Regain Control
Eventually, buying pressure begins to fade.
As sellers return to the market, price breaks below the lower boundary of the flag. This downside breakout often attracts additional selling as momentum traders and short sellers join the move.
Many traders consider this breakout the confirmation that the bear flag has completed.
Rather than entering during the bounce, they wait until price clearly breaks below support.
Why Bear Flags Can Fool Traders
Understanding why bear flags develop can help you avoid one of the most common trading mistakes.
After a sharp decline, it’s normal for price to stabilize or recover slightly. To some traders, that bounce looks like the beginning of a reversal. In reality, it often reflects nothing more than a temporary pause in the existing downtrend.
If selling pressure remains dominant, the recovery usually fades and the market continues moving lower. That’s why a bear flag is generally considered a continuation pattern rather than a bullish reversal signal.
Market Psychology Behind a Bear Flag
Every bear flag tells a story about the balance between buyers and sellers.
Here’s what that story typically looks like:
Stage
Buyers Think
Sellers Think
Sharp Decline
“Maybe it’s oversold.”
“The trend is still down.”
Recovery
“This could be the bottom.”
“I’ll wait for a better selling opportunity.”
Breakdown
“The bounce has failed.”
“Time to sell again.”
Continuation
Buying weakens.
Selling momentum accelerates.
One interesting aspect of bear flags is that the recovery itself can attract more buyers. Ironically, that often provides sellers with additional liquidity before the next move lower.
This tug-of-war between hope and caution is one reason why bear flags remain one of the most closely watched continuation patterns in technical analysis.
How Traders Confirm a Bear Flag
A rising channel alone doesn’t automatically qualify as a bear flag.
Experienced traders usually look for several confirmation signals before acting.
Common signs include:
- A clear downtrend before the pattern forms
- A relatively shallow recovery
- Declining trading volume during consolidation
- A decisive breakdown below support
- Increasing selling volume after the breakdown
Some traders also combine bear flags with moving averages, RSI, MACD, or support and resistance analysis to strengthen their conviction.
Using multiple forms of confirmation doesn’t eliminate risk, but it can help filter out weaker setups.
Common Mistakes When Trading a Bear Flag
Bear flags can be highly effective, but they’re also easy to misinterpret.
Here are a few mistakes traders frequently make.
Assuming Every Bounce Is a Reversal
This is probably the most common mistake.
A short-term recovery doesn’t automatically mean the downtrend has ended. Waiting for confirmation can help distinguish a genuine reversal from a temporary bounce.
Selling Too Early
Some traders enter short positions as soon as price begins to rise inside the flag.
While the overall idea may be correct, entering before the breakdown increases the risk of getting caught in a larger recovery.
Patience often leads to better trade entries.
Ignoring the Overall Market
A bear flag becomes more convincing when it aligns with the broader market trend.
If the overall market is strongly bullish, bearish continuation patterns may have a lower probability of success.
Looking at higher timeframes can provide valuable context before entering a trade.
Overlooking Volume
Like bull flags, bear flags often show a specific volume pattern.
Volume typically decreases during consolidation and increases when price breaks below support.
A weak breakdown without increased selling activity may deserve additional caution.
Bull Flag vs Bear Flag: The Biggest Differences
By now, you’ve probably noticed that bull and bear flags aren’t difficult to recognize once you know where to look. The challenge isn’t identifying the shape—it’s understanding the context.
That’s why experienced traders rarely look at the flag first. Instead, they ask a simple question:
What was the market doing before this consolidation began?
The answer usually tells you whether you’re looking at a bullish continuation or a bearish one.
Here’s a side-by-side comparison of the two patterns.
Feature
Bull Flag
Bear Flag
Market Trend
Forms during an uptrend
Forms during a downtrend
Flagpole
Strong bullish rally
Sharp bearish decline
Direction of the Flag
Slightly downward or sideways
Slightly upward or sideways
Expected Outcome
Breakout above resistance
Breakdown below support
Typical Trading Bias
Long positions
Short positions
Market Psychology
Buyers pause before pushing higher
Sellers pause before driving prices lower
Volume Pattern
Falls during consolidation, rises on breakout
Falls during consolidation, rises on breakdown
Common Risk
False bullish breakout
False bearish breakdown
Although the patterns mirror one another visually, they represent two very different market environments. That’s why treating them as interchangeable can lead to costly mistakes.
Bull vs Bear Flag: Understanding Market Psychology
Charts don’t move because of lines or patterns—they move because people make decisions.
Every flag pattern reflects thousands of traders reacting to the same price movement. Understanding those reactions can help you read a chart with much more confidence.
A Bull Flag Tells a Story of Confidence
When a bull flag forms, buyers remain in control even though momentum temporarily slows.
Rather than seeing the consolidation as a sign of weakness, many traders view it as the market resetting before another potential move higher. Once demand outweighs supply again, price breaks above resistance and the uptrend resumes.
The key takeaway is that buyers never truly lose control—they simply pause before continuing the trend.
A Bear Flag Tells a Story of Caution
A bear flag tells the opposite story.
Although buyers manage to slow the decline for a short time, they fail to build enough momentum to reverse the broader downtrend. As selling pressure returns, price breaks below support and the bearish trend continues.
In other words, the recovery reflects hesitation rather than a lasting shift in market sentiment.
Why This Matters
One reason traders misread flag patterns is that they focus only on the candles inside the consolidation.
In reality, the consolidation is just one chapter of the story.
The move that comes before the flag—and the strength of the breakout that follows—usually carries much more weight than the flag itself.
If you train yourself to read the market in terms of momentum rather than shapes, spotting quality setups becomes much easier.
How to Identify Bull Flag and Bear Flag Patterns Faster
You don’t need dozens of indicators to recognize a flag pattern.
In many cases, a clean chart and a structured checklist are enough.
When reviewing a chart, work through these questions one at a time.
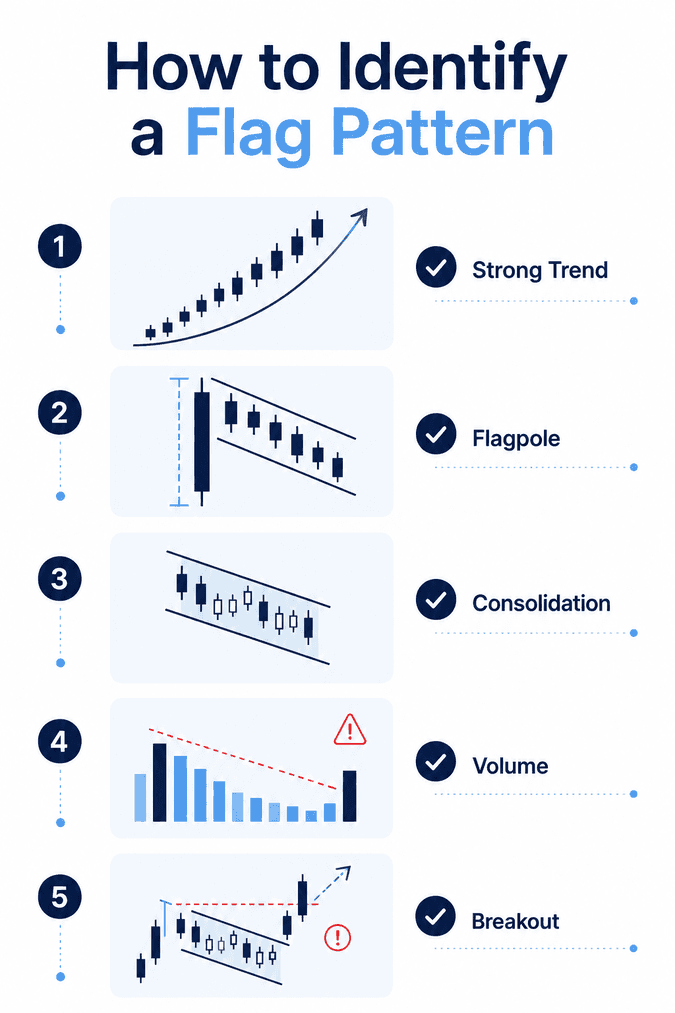
1. Is There a Clear Trend?
A flag pattern should always follow a strong directional move.
If price has been drifting sideways for days or weeks, you’re probably looking at a range rather than a continuation pattern.
2. Is the Consolidation Controlled?
Healthy flag patterns tend to be orderly.
Price usually moves inside a narrow channel instead of making large, unpredictable swings.
If volatility suddenly increases during the consolidation, the pattern becomes less reliable.
3. Does the Breakout Match the Previous Trend?
This is where confirmation becomes important.
A bull flag should break above resistance.
A bear flag should break below support.
If price breaks in the opposite direction, the original setup may no longer be valid.
4. Does Volume Support the Move?
Volume often provides the final piece of the puzzle.
Although every market behaves differently, many traders look for:
- Strong volume during the flagpole
- Lighter volume while the market consolidates
- A noticeable increase in volume when price breaks out
That sequence suggests the original trend still has momentum behind it.
Quick Recognition Checklist
Whenever you spot what looks like a flag pattern, ask yourself:
- Was there a strong move before the consolidation?
- Is the pullback relatively small?
- Does the consolidation stay inside a clear channel?
- Has momentum slowed without completely reversing?
- Is the breakout supported by higher trading volume?
If several of these conditions are missing, it’s worth taking a closer look before assuming you’ve found a classic bull or bear flag.
When Bull and Bear Flag Patterns Fail
Even well-formed flag patterns can fail. Market conditions change quickly, and no setup guarantees a successful trade.
One of the most common reasons is a false breakout, where price briefly moves beyond support or resistance before reversing.
Flag patterns are also more likely to fail when:
- Trading volume remains weak during the breakout
- Major news triggers sudden volatility
- Strong support or resistance levels are nearby
- The breakout goes against the higher-timeframe trend
Instead of rushing into every breakout, many traders wait for confirmation, such as a strong closing candle or a successful retest of the breakout level.
Common Mistakes Traders Make
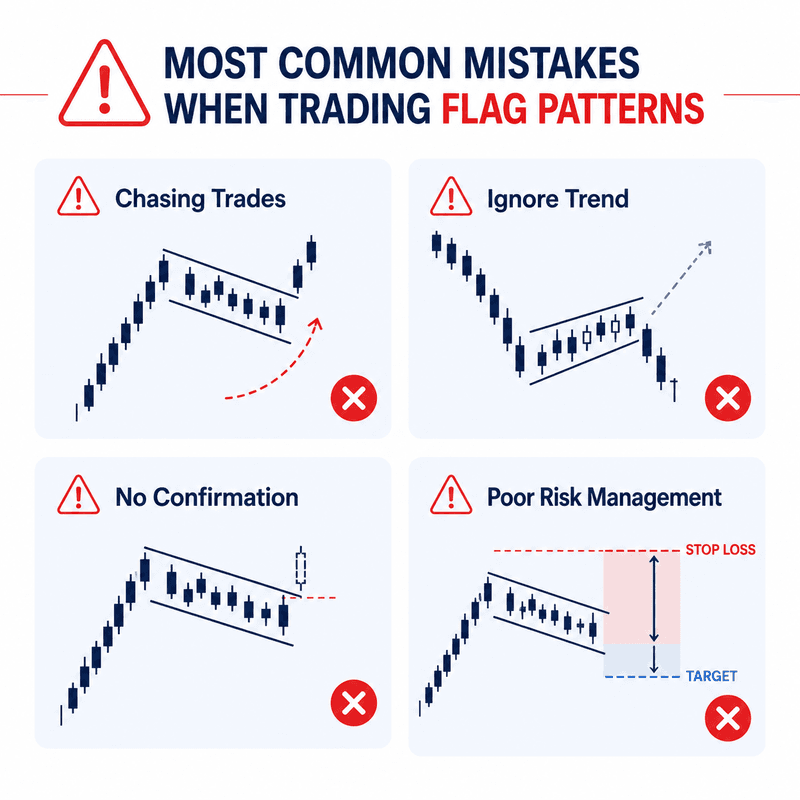
Even experienced traders make mistakes, but avoiding a few common ones can improve your decision-making.
- Trading every flag pattern: Not every consolidation is a valid setup.
- Ignoring the broader trend: Always check whether the pattern aligns with the overall market direction.
- Skipping confirmation: Entering before the breakout increases the risk of false signals.
- Neglecting risk management: Use stop-loss orders and avoid risking too much on a single trade.
- Chasing breakouts: Jumping in after a large move can lead to poor entries and unfavorable risk-to-reward ratios.
Patience and discipline often matter just as much as recognizing the pattern itself.
Final Thoughts
At first, bull flag vs bear flag can seem confusing because the two patterns look so similar. But once you learn to focus on the trend before the consolidation, telling them apart becomes much easier.
Neither pattern guarantees what the market will do next. Even so, they can provide valuable clues when combined with volume, market structure, and sensible risk management. Whether you’re actively trading or simply managing assets in a crypto wallet, the more charts you study, the faster you’ll recognize these setups and understand what they’re telling you.
Frequently Asked Questions
Yes. You can find these patterns on charts ranging from one minute to one month. Higher timeframes often attract more attention because they tend to reflect stronger trends.
They can. Crypto traders frequently use both bull and bear flags, although the market’s higher volatility means many traders look for additional confirmation before entering a trade.
There’s no fixed duration. Some flags form within a few candles, while others may take days or even weeks depending on the market and timeframe.
Absolutely. Markets can reverse unexpectedly, which is why many traders use stop-loss orders and avoid risking too much on a single setup.
It’s usually better to practice identifying them on historical charts or in a demo account first. That helps you recognize stronger setups and avoid common mistakes.


